Number of commits is not a good metric for productivity, project health or anything else really. But let’s pretend! It may be OK as a simple activity indicator…
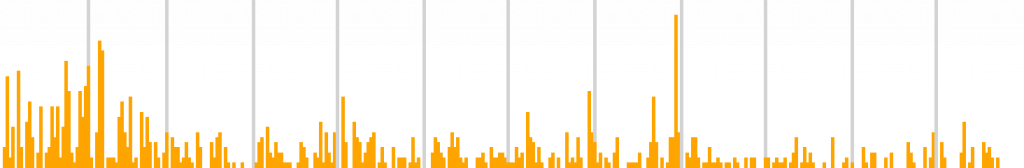
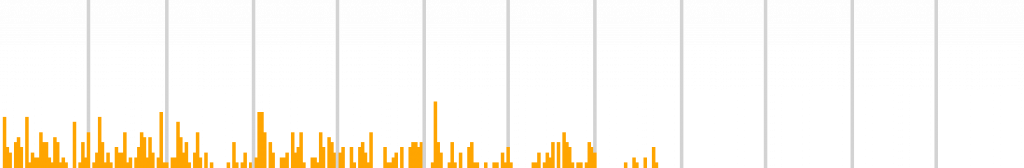
Here’s a Python script I made that graphs daily commit counts on a git repository by year.
Download the script here. Requires Python 3 and PIL/Pillow.
Usage:
pip3 install pillow
python3 activity.py /path/to/imgui imgui
Output:
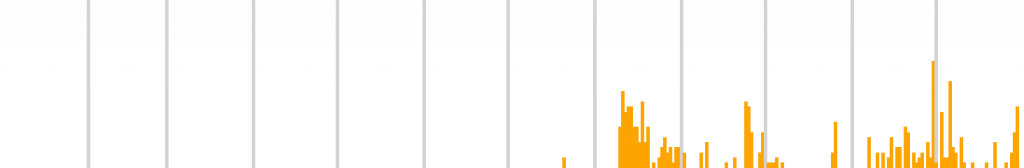
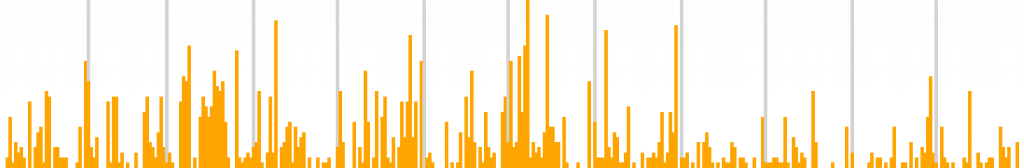
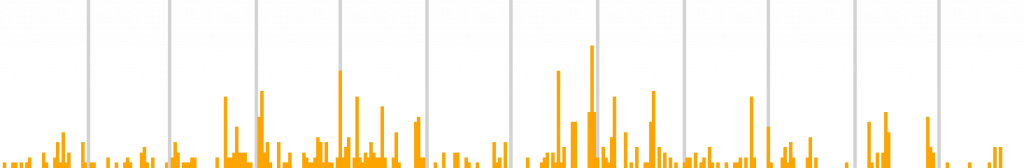
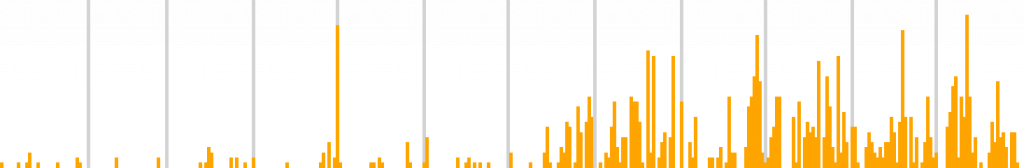
imgui-2014.png
imgui-2015.png
imgui-2016.png
imgui-2017.png
imgui-2018.png
imgui-2019.png
Example output for imgui: